
Holding your winners can be one of the hardest things to do as a portfolio manager. A position runs up 10, 20, or 30 percent and the initial reaction is to “take the trade”. If you take the gain, you win, bottom line. You buy a stock at $50, sell is at $60 and you just made 20%. When the stock pulls back to $50, you look like a hero. However, what happens if the stock doesn’t pullback? What happens if stock rallies to $100? Perhaps a more likely scenario is you buy a stock at $50, then watch it rally to $60, then pullback to $55. What do you do? How do you manage the position? Do you lock in a 10% gain or hang on for the ride? These are questions that get asked every, single day by portfolio managers, and for managers without an objective lens to evaluate the position, these questions become more difficult to answer.
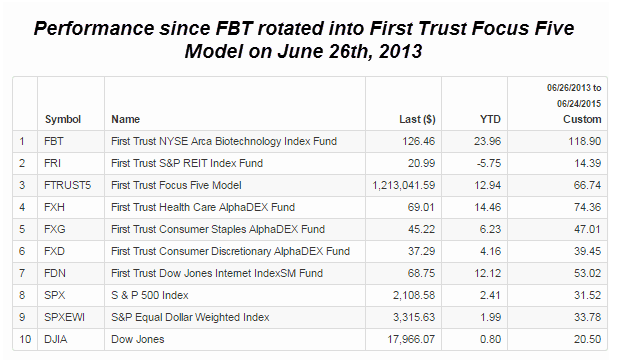
For a portion of our portfolios, we follow the First Trust Focus Five Model, which provides us with a timely example of how relative strength helps you stay with those winning trades over time. Specifically, we are talking about the First Trust NYSE Arca Biotechnology ETF (FBT) which moved into the Focus Five Model on June 26th, 2013. That change was a result of the First Trust S&P REIT Index Fund falling far enough on the relative strength matrix rankings to be removed, and FBT was the highest ranking sector that was not in the model at the time. Since moving into the Focus Five Model, FBT has not only outperformed the overall market, but has been the best performing position within the model. From June 26th, 2013 through June 24th, 2015 FBT is up 118.90% while the S&P Index is up just 31.52%.
The performance trend for FBT has not been a nice, smooth straight line from point A to point B, and the Biotech sector, as a whole, has come under fire over the past few years, whether it’s been from the media, the Federal Reserve or even the US Food and Drug Administration. So, if your only guidance in owning Biotech stocks was to listen to the financial media, or Janet Yellen for that matter, then holding this “winner” has been tough. However, FBT has consistently ranked among the top five sectors within the Focus Five matrix ranking and has never given us a reason to remove it from the model based solely on the rules of the model.
Below is a timeline of some events that have unfolded over the past couple of years as it relates to FBT and the Biotech sector as a whole:
- June 26th, 2013 – FBT rotates into Focus Five Model. By June 26th, 2013 FBT was up 30% since the October 2012 low and up 80% since the October 2011 lows. Buying FBT at this time didn’t necessarily “feel” like the warm and fuzzy thing, but this is where the systematic, rules-based process forces the portfolio to adapt to the trends.
- Spring 2014 – Biotech stocks corrected, and in the case of FBT, the correction was roughly -20% from its February 2014 high to the April 2014 low. FBT never fell out of the top five of the relative strength matrix, therefore, it remained in the model through this correction.
- July 16th, 2014 – Janet Yellen makes comments on Biotech stocks. While she stopped short of actually saying “sell your Biotech stocks,” her comments at the time were, “Valuation metrics in some sectors do appear substantially stretched—particularly those for smaller firms in the social media and biotechnology industries, despite a notable downturn in equity prices for such firms early in the year.” If the Federal Reserve Chair is saying this, it must be true, right? Well, maybe, but that doesn’t mean the trend in outperformance cannot persist and that is exactly what we have seen.
- 2015 – The Biotech sector has remained at the top of the relative strength rankings, and FBT has been the best performing sector within the Focus Five lineup this year, posting a return of 23.96% through June 24th.
This is merely one example of how relative strength can help give you a little more confidence to stay with your winning trades. Trends in the market can last for many years, and in some cases for much longer than we might expect. Relative strength provides the tool that helps us identify new trends that are emerging, but it also identifies when trends in outperformance are over, like Real Estate in June 2013. The same is true here. When the trend in Biotech and Healthcare has come to an end, we will see the change in strength show up in the relative strength rankings.
Leave A Comment